Visually Impaired Users’ Digital Accessibility Experience Survey Results Announced

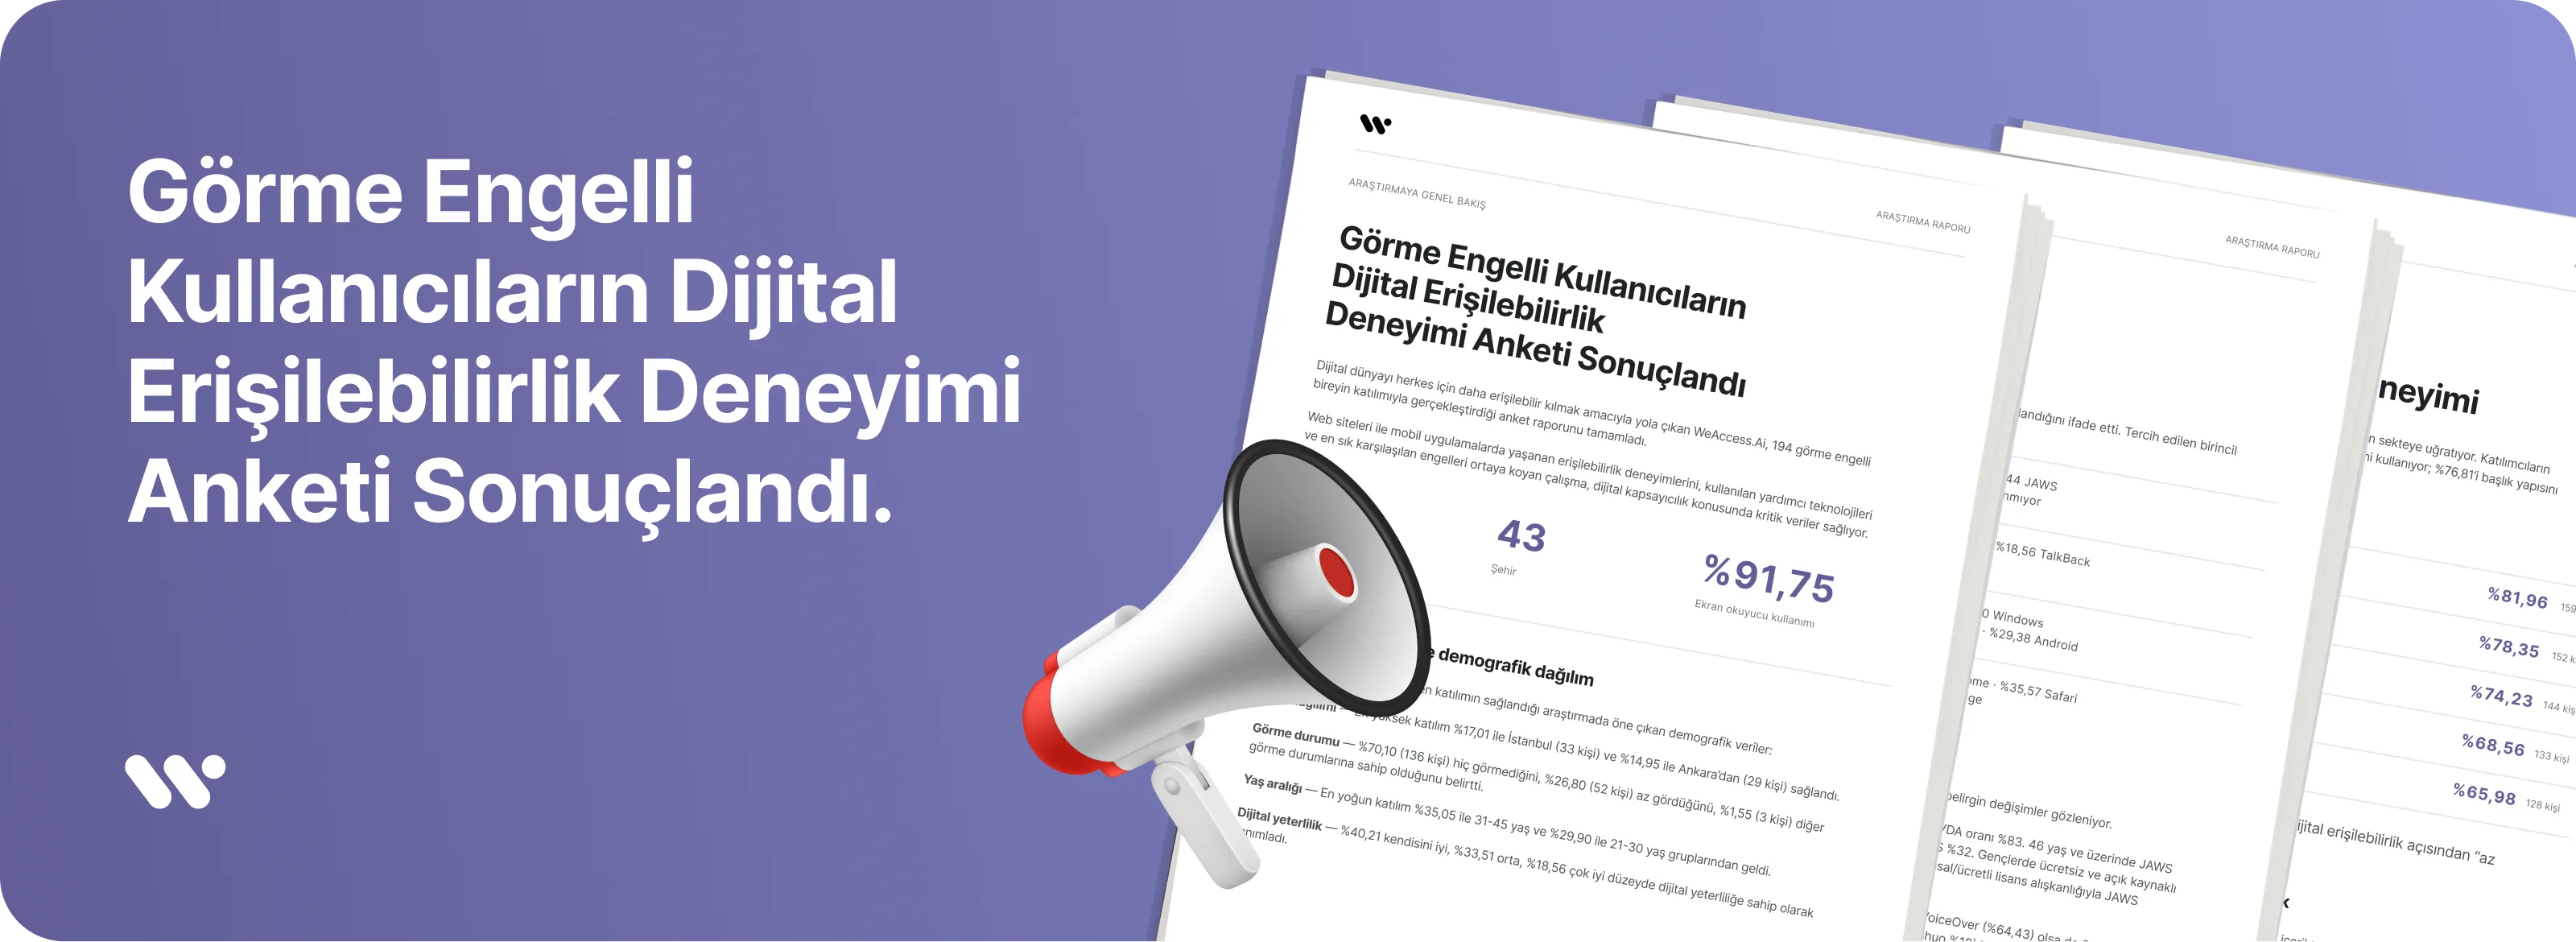
With the goal of making the digital world more accessible for everyone, WeAccess.Ai has completed its “Digital Accessibility Experience Survey of Visually Impaired Users” report, conducted with the participation of 194 visually impaired individuals. The study reveals accessibility experiences on websites and mobile applications, the assistive technologies used, and the most common barriers. It provides critical data on digital inclusion.
Participant Profile and Demographic Distribution
The survey drew participants from 43 cities across Türkiye. Key demographic findings are as follows:
City Distribution: The highest participation came from Istanbul at 17.01% (33 people) and Ankara at 14.95% (29 people).
Visual Status: 70.10% of participants (136 people) stated they are totally blind, 26.80% (52 people) have low vision, and 1.55% (3 people) reported other visual conditions.
Age Range: The highest participation came from the 31–45 age group at 35.05% and the 21–30 age group at 29.90%.
Digital Proficiency: 40.21% of participants described their digital proficiency as good, 33.51% as moderate, and 18.56% as very good.
Assistive Technology and Device Usage
91.75% of participants (178 people) stated that they actively use a screen reader. Their primary software and devices are listed below:
| CategoryDistribution and Preferences | |
| Desktop Screen Reader | 56.19% NVDA, 31.44% JAWS, 12.37% Other / None |
| Mobile Screen Reader | 64.43% VoiceOver, 18.56% TalkBack, 10.82% Jieshuo |
| Operating Systems | Desktop: 93.30% Windows; Mobile: 64.43% iOS, 29.38% Android |
| Most Used Browsers | 68.04% Google Chrome, 35.57% Safari, 12.89% Microsoft Edge |
Note (Screen Reader Usage by Age and Changing Trends):
When screen reader usage is analyzed by age group, clear shifts appear in desktop and mobile screen reader preferences as age increases.
Desktop Screen Reader Shift (NVDA → JAWS): Younger users prefer the free, open-source NVDA (83% NVDA among those aged 30 and under). With age, JAWS becomes dominant due to long-standing habits tied to institutional and paid licenses (68% JAWS among those aged 46 and over, 100% among those 65+). The 31–45 age group is in a transition phase (NVDA 58%, JAWS 32%).
Android Screen Reader Dominance Among Young Users: While VoiceOver leads overall on mobile (64.43%), Android screen readers together reach 54.5% (TalkBack 36%, Jieshuo 18%) in the 20-and-under group, surpassing VoiceOver (32%).
Age Limit of Jieshuo Usage: The Android screen reader Jieshuo appeals entirely to a younger audience. All Jieshuo users are aged 45 or under; there are no Jieshuo users aged 46 and over.
Changing Combinations: Among younger users, the most common pairing is NVDA + VoiceOver (41%), while in the 46-and-over group the dominant pairing is JAWS + VoiceOver (53%). VoiceOver on Mac desktop remains a niche choice (5 people in total), concentrated mainly in the 21–30 age group.
Accessibility Barriers on Digital Platforms
The survey results show that software and design shortcomings directly disrupt the user experience. 68.04% of participants said they use the heading hierarchy to find information on long pages, and 76.81% emphasized that heading structure (H1–H6) is important.
Top 5 Most Common Accessibility Barriers:
- Unlabeled and unclear buttons: 81.96% (159 people)
- Text that cannot be read by screen readers: 78.35% (152 people)
- Unlabeled and unclear links: 74.23% (144 people)
- No audio verification option (CAPTCHA): 68.56% (133 people)
- Images without alternative text (alt text): 65.98% (128 people)
“57.22% of participants rated social media platforms as only ‘slightly’ adequate in terms of digital accessibility.”
User Responses to Barriers and Public Awareness
When facing an accessibility barrier, 56.70% of participants try to make use of the content in some way, while 48.97% contact the site’s management or developer. 38.66% choose to raise awareness on social media, and 29.90% prefer to take legal action. Meanwhile, 25.77% stop using the inaccessible platform altogether.
81.96% of respondents (159 people) to the Digital Accessibility Experience Survey of Visually Impaired Users stated that they would like to stay informed about WeAccess’s future accessibility initiatives. WeAccess.Ai will continue its awareness and transformation efforts for a barrier-free digital world.